Advanced Search and Reports
If you know how to search, you also know how to create a report. That's because every set of search results on TechPort automatically generates a set of reports.
One of the most powerful features available in TechPort is the ability to generate reports on NASA technologies. Each search automatically produces a set of reports highlighting specific attributes for all of the technologies matching your search criteria. These reports include information about project status, Technology Areas (TAs), technology maturity, work locations, lead and supporting organizations, responsible Mission Directorates or Offices, responsible programs, and co-funding partners.
Reports can be used to conduct multi-year trending analyses, visualize who is doing the work and where it is being done, detect gaps in NASA technology development, and identify the specific technology areas in which NASA is investing funds. Because TechPort reports are based on search results, they can be tailored to specific areas of interest. This provides a powerful tool for technology developers, researchers, innovators, and proposers, across the vast spectrum of NASA technologies.
The Basics
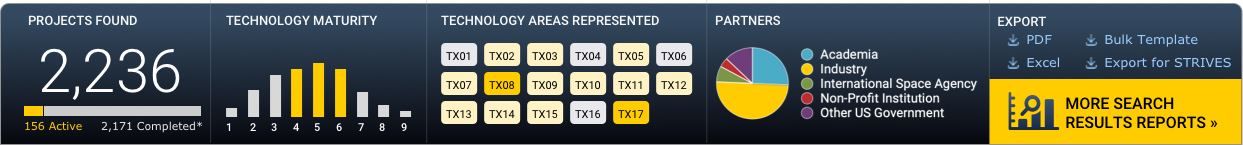
Enter a word or phrase into the search bar at the top of any TechPort page. When you click “Search”, an analysis of your search results will appear above the search results. Click on “More search result reports” to see a set of reports for the projects you found.
To refine your search results, and the reports they generate, click “Advanced Search”, just beneath the search bar at the top of every TechPort page. There are eleven different filters that will help you tailor your search results and reports for the data you need.
Take control of your reports
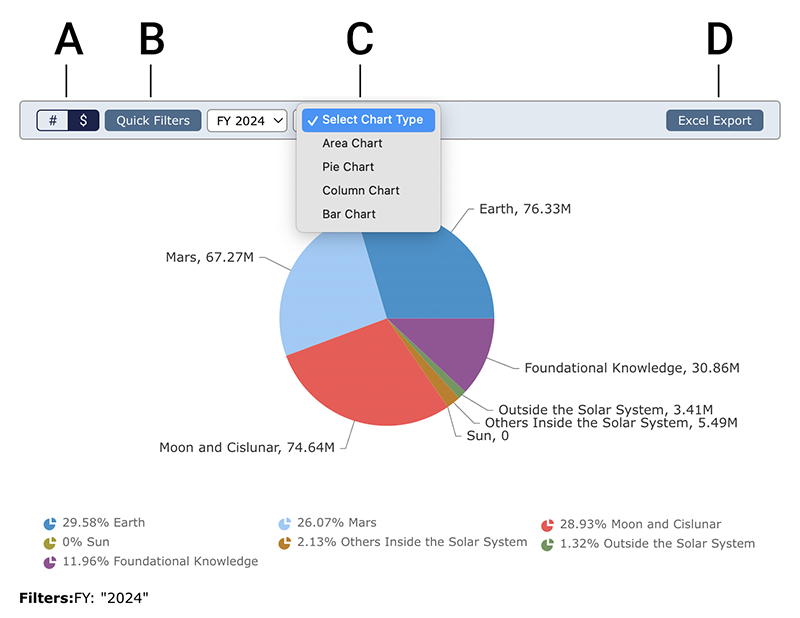
An example of a chart